

The endless flood of data does not stop at HR’s door. Historical HR processes are causing the amount of data to balloon. Our task now is to glean and process the most important information from all the available data. This gives HR an opportunity to create added value in the age of Big Data.
Identify talent and fluctuation risks in your HR data
Is your organisation concerned with remaining competitive and innovative? This question becomes especially important as the number of available experts decreases. How does a company maintain strength in times of demographic change and a small talent pool?
One important criterion for remaining competitive and innovative is the ability to identify and retain talented employees. Once this is accomplished, half the battle is won. Some companies, however, are unaware at the highest administrative level where the best talent can be found for specific tasks from within the company’s own ranks.
An overview of the vast quantities of HR data needs to be obtained. Personnel and organisational relationships need to be depicted so that qualified employees can be identified within the company’s structure. In addition, key employees need to be identified who are endangered by business fluctuations. This enables a rational approach to planning for succession as well as ensuring competence.
Data pools are rarely exploited to their full capacity
In many companies, data is already available that can facilitate these goals.
And yet frequently, the problem is that the data structure is inadequate. Managing “big data” has become a live issue that is especially relevant in large companies. By properly managing big data, enormous amounts of information can be insightfully processed at lightning speed.
The management of data is essential to HR. However, HR data is often not evaluated and visualised appropriately. The potential of the available data exists, but it is not fully exploited. The advantages of big data are not utilised.
Solution: Insightfully process and depict HR data
The potential of existing personnel and performance data can be tapped when the data is presented in comprehensible manner, and one way of doing this is the company organisational chart.
HR employees as well as managers are provided with an overview of organisational units, positions and employees. The personnel and organisational structure as well as relevant personnel data can be presented in the organisation chart (image below).
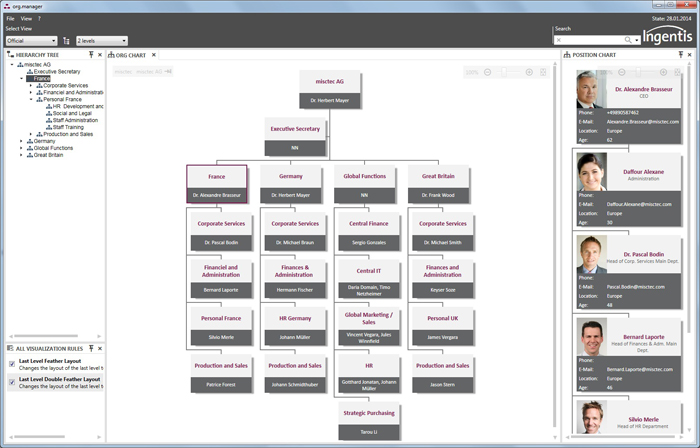
This allows unoccupied positions to be identified. Furthermore, additional information such as the e-mail address, telephone and room number can be outputted in the employee list. By evaluating relevant personnel indexes through HR reporting in the organisation chart, gender distribution, age structure, staffing levels, etc. can be visualised with just a few clicks.
This HR data can then be evaluated in real time to provide clarification – an important tool in generating organisational structures.
Identify talented employees
One essential element in hands-on, effective HR management is determining which employees have the greatest development potential.
Which employees possess particular expertise and contribute significantly to the success of the company? High-performers who are capable of development need to be identified, and an overview of the personnel and organisation structure needs to be retained.
Frequently, the data is available to achieve this, but there is no way to display the data in a structured manner since the data is (for example) captured by different systems. One way of combining this information is to use the potential performance grid.
This grid can be directly visualised in the organisation chart (see image below).
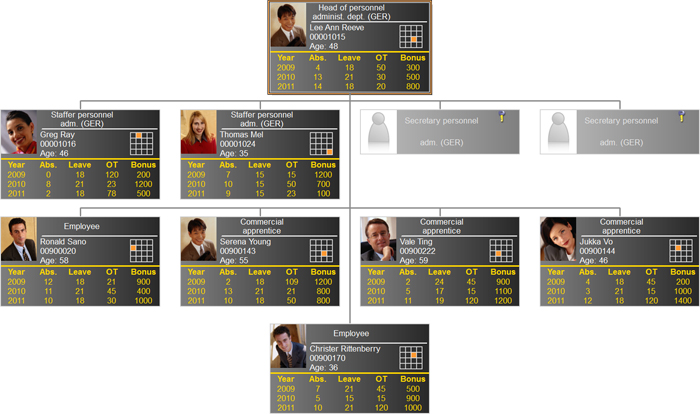
The matrix displays performance as well as the development potential of individual employees. Furthermore, additional employee and performance details such as absences (Abs.), utilised vacation time (Leave) and overtime (OT) can be shown.
Identify fluctuation risks early on
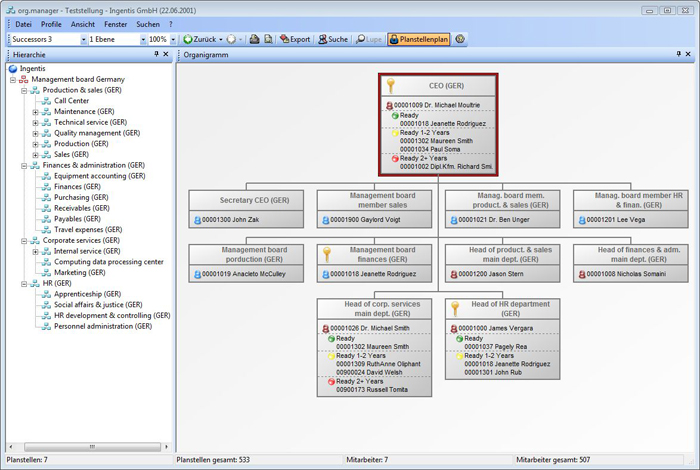
One final question: How high is the risk of losing these important employees? Is there a danger of them leaving the company?
One option is to depict the fluctuation risk in the organisation chart by, for example, using color to highlight employees or positions with a high-risk potential. At the same time, succession planning is initiated to find a timely replacement for employees who are likely to leave. Appropriate successors can be directly displayed in the organisation chart to help with successor planning. It is also recommendable to display the availability of appropriate successors (see image below).
Summary
Many companies are presently fighting over a diminished talent pool and to maintain their competitive edge.
Letting helpful HR data lie fallow is a tragedy since it can provide useful information about talented employees or those ready to jump ship. Exploiting big data in HR, for example by attractively visualising data, poses a significant opportunity for personnel departments and companies. This is an opportunity to glean more value from HR data and to make it easier to evaluate. The trend to exploit big data in HR will only increase in the future.


One Response
Christine, very good examples
Christine, very good examples. With the explosion of big data, companies are faced with data challenges in three different areas. First, you know the type of results you want from your data but it’s computationally difficult to obtain. Second, you know the questions to ask but struggle with the answers and need to do data mining to help find those answers. And third is in the area of data exploration where you need to reveal the unknowns and look through the data for patterns and hidden relationships. The open source HPCC Systems big data processing platform can help companies with these challenges by deriving insights from massive data sets quick and simple. Designed by data scientists, it is a complete integrated solution from data ingestion and data processing to data delivery. Their built-in Machine Learning Library and Matrix processing algorithms can assist with business intelligence and predictive analytics. More at http://hpccsystems.com